The Full Picture on Tomorrow's Industries
Track 74 companies across 8 emerging sectors. Compare financials, explore market trends, and dive into the data that drives investment decisions.
Everything You Need for Smarter Analysis
From raw financials to AI-driven insights — the tools serious investors use.
Ask Sterling
Ask questions about any company's financials in natural language. Context-aware AI that reads the data you're viewing.
Sector Intelligence
Dive into 5 sectors with market share, deliveries, regional breakdowns, and competitive rankings.
Mega Chart
Overlay any combination of metrics on a single chart. Revenue vs. margin vs. stock price — all in one view.
Side-by-Side Compare
Compare companies with smart zoom, auto-scaling, and full-height interactive charts across sectors.
SEC Filings
Read 10-K, 10-Q, and other SEC filings directly in the app. No more digging through EDGAR.
Revenue Flow Diagrams
Sankey diagrams that visualize how revenue flows through costs and expenses down to net income.
74 Companies
With many more on the way
Explore by Sector
Deep-dive reports with market share, competitive analysis, and growth trends.

Electric Vehicles
Explore the companies driving the electric vehicle revolution. Discover key players, compare product lineups, and track the shift from combustion to electric.

Autonomous Driving
Discover the companies building self-driving technology and advanced driver assistance systems. Compare approaches from vision-only to lidar, and track the road to full autonomy.

AI Chips & Semiconductors
Explore the companies designing the chips that power artificial intelligence. From GPUs to custom accelerators, discover who's enabling the AI revolution.

Charging Infrastructure
Explore the companies building the charging networks that power electric vehicles. Compare network coverage, charging speeds, and the race to deploy infrastructure worldwide.
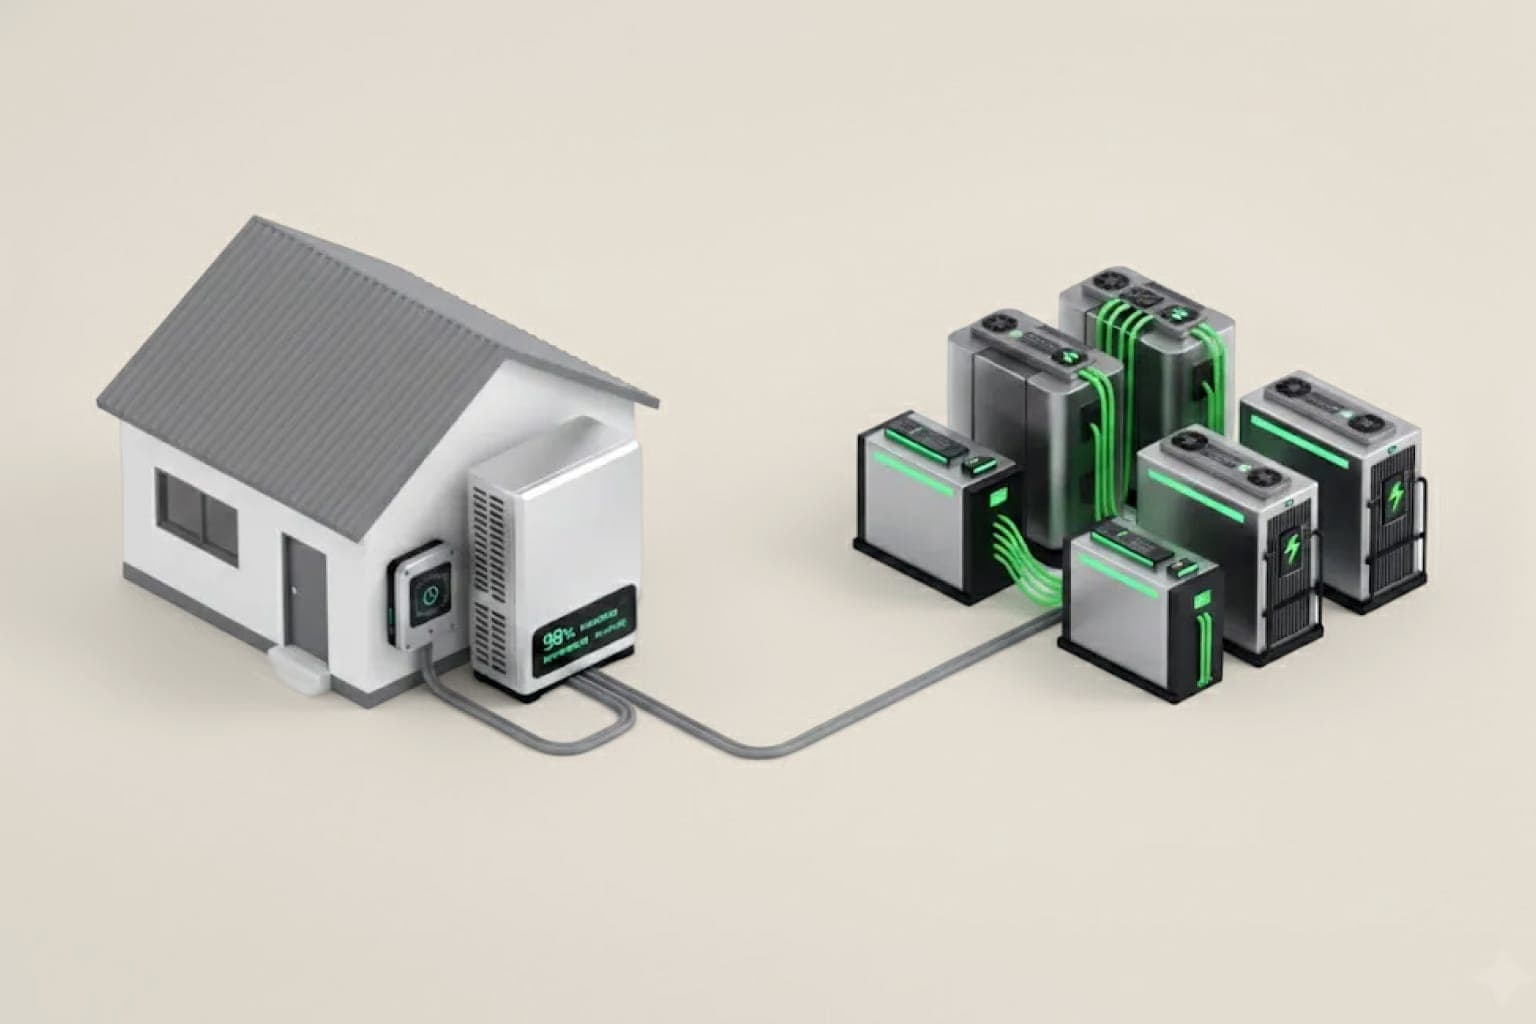
Battery & Energy Storage
Explore the companies powering EVs and the energy grid. From lithium suppliers to next-gen solid-state innovators, discover who's shaping the future of energy storage.

Humanoid Robots
The race to build general-purpose humanoid robots — from Tesla Optimus to Figure AI, Agility Robotics, and China's fast-growing ecosystem. Explore specs, funding, economics, and the supply chain behind the next frontier of AI.
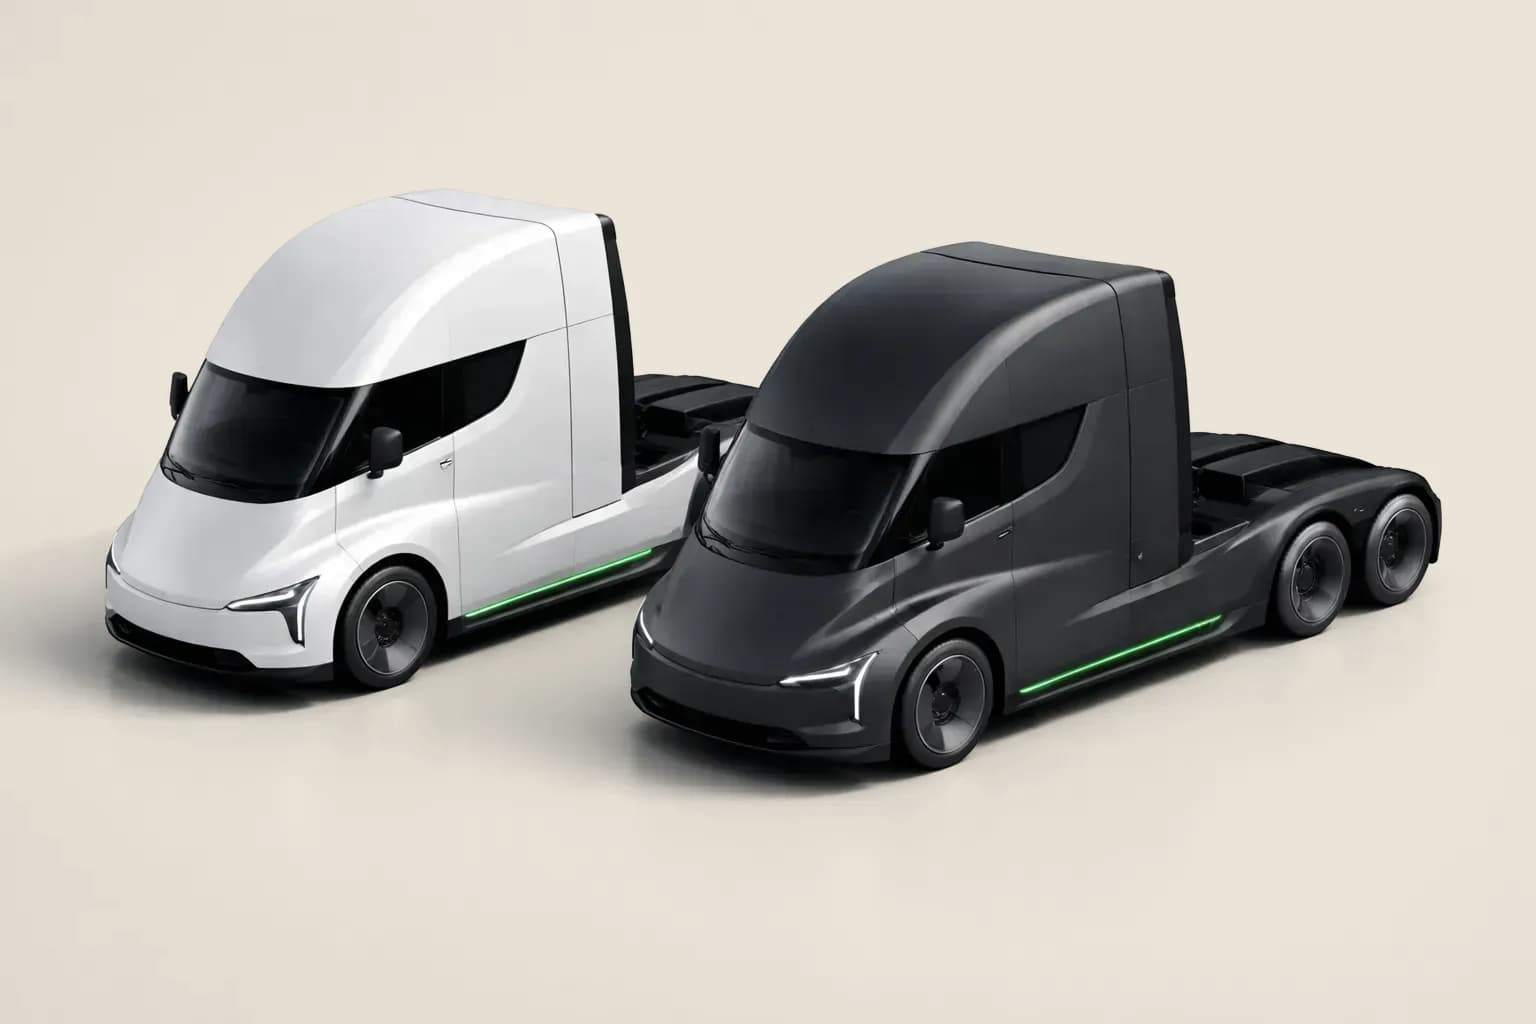
Electric Semi Trucks
The electrification of Class 8 heavy-duty trucking — from Tesla Semi and Freightliner eCascadia to fuel cell alternatives from Nikola and Hyundai. Tracking OEM production ramps, fleet adoption, charging infrastructure buildout, TCO economics, and the regulatory push toward zero-emission freight.
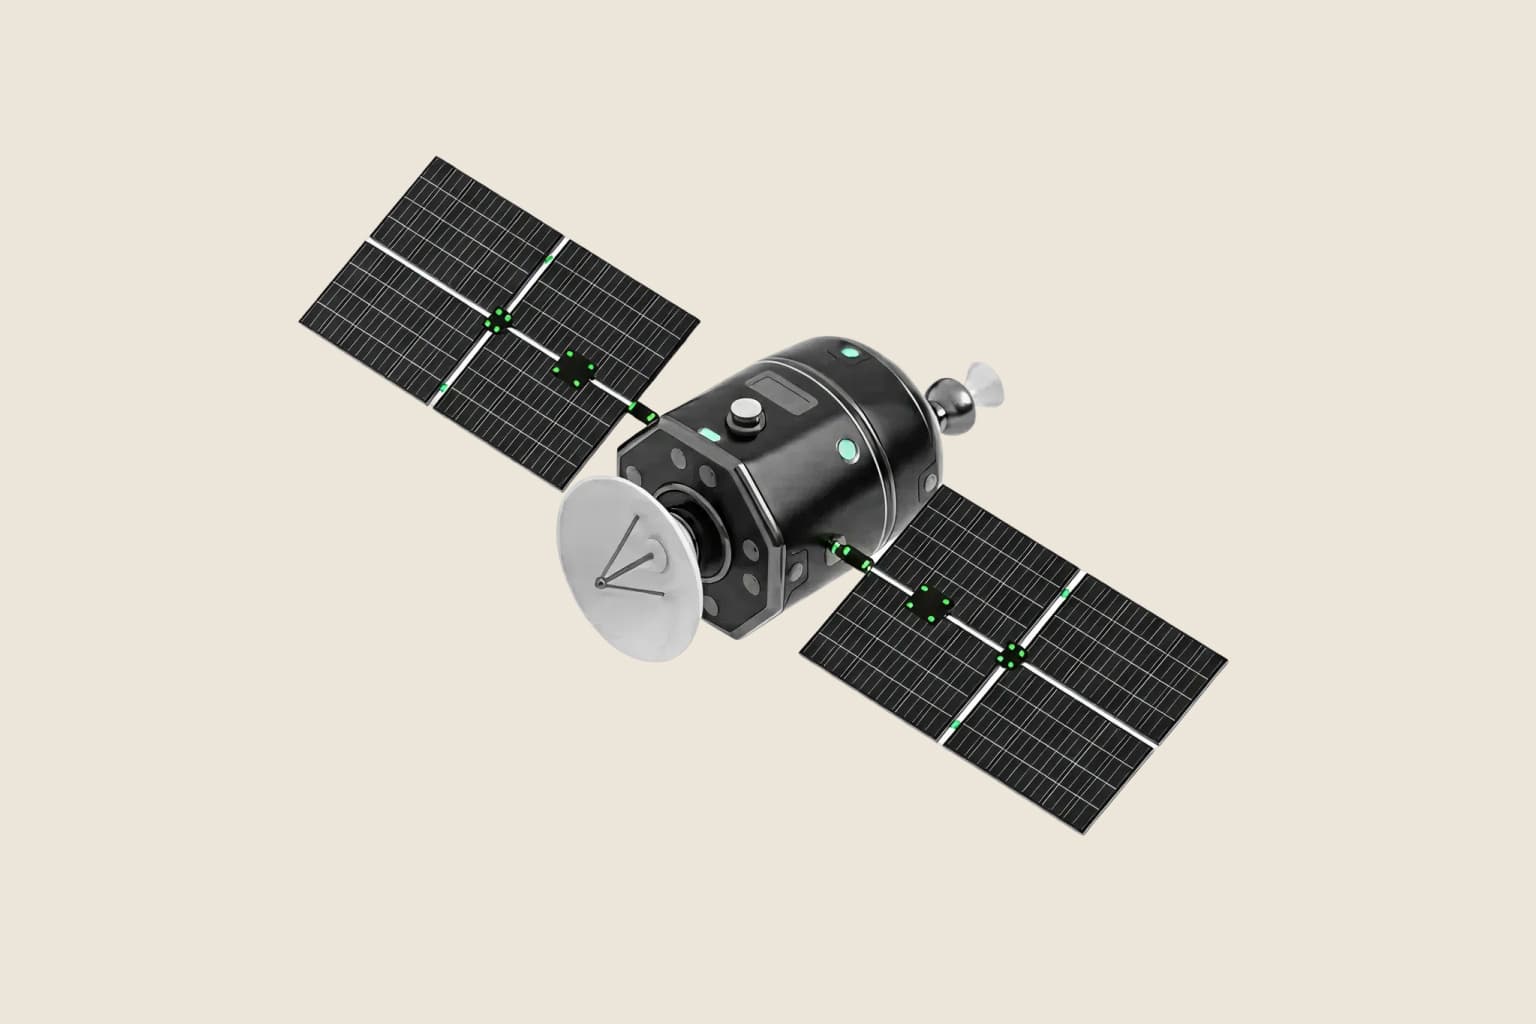
Space Data Centers
Computing infrastructure deployed in orbit to process satellite data in real-time, leverage unlimited solar power, and free radiative cooling. The sector reached an inflection point in late 2025 with the first GPU (NVIDIA H100) and first LLM trained in space, followed by SpaceX filing for a 1-million-satellite orbital DC constellation.
Simple, Transparent Pricing
Full access to all features. $19/month or $149/year. Cancel anytime.
- Full historical financial data
- Mega Chart — overlay any metrics
- Unlimited side-by-side comparisons
- Ask Sterling AI assistant
- Sector reports & competitive analysis
- SEC filings viewer (10-K, 10-Q)
- Live stock charts with split markers
Frequently Asked Questions
What is Sterling?
Sterling is a financial analytics platform that tracks 74+ public companies with standardized metrics like revenue, profit, margins, and EPS, plus company-specific KPIs such as iPhone unit sales and Tesla deliveries. Data is sourced from SEC filings and updated quarterly.
What companies does Sterling cover?
Sterling covers 74+ companies across technology (Apple, NVIDIA, Microsoft, AMD), electric vehicles (Tesla, BYD, Rivian, NIO), autonomous driving (Mobileye, Aurora, Waymo), semiconductors (TSMC, ASML, Broadcom), batteries (CATL, LG Energy), and EV charging (ChargePoint, EVgo).
Where does the financial data come from?
All financial data is sourced from public SEC filings (10-K and 10-Q reports), official company earnings releases, and regulatory disclosures. Sterling parses these filings to extract standardized metrics with 10+ years of historical coverage.
Can I compare companies side by side?
Yes. Sterling's Compare tool lets you place any two or more companies side by side and compare revenue, margins, EPS, growth rates, and other metrics with interactive charts that auto-scale for meaningful comparison.
What are sector reports?
Sterling provides in-depth sector reports for 8 industries: Electric Vehicles, Autonomous Driving, AI Semiconductors, Battery & Energy Storage, Charging Infrastructure, Humanoid Robots, Electric Semi Trucks, and Space Data Centers. Each report includes competitive analysis, market data, and company rankings.
How much does Sterling cost?
Sterling is $19/month or $149/year (save 35%). Full access to all features — cancel anytime.
Can I cancel anytime?
Yes. You can cancel your subscription at any time from your account settings. You'll retain access until the end of your billing period.
Start Exploring Today
74 companies, 8 sectors, AI-powered analysis, and 10+ years of financial data. Subscribe for full access — cancel anytime.